
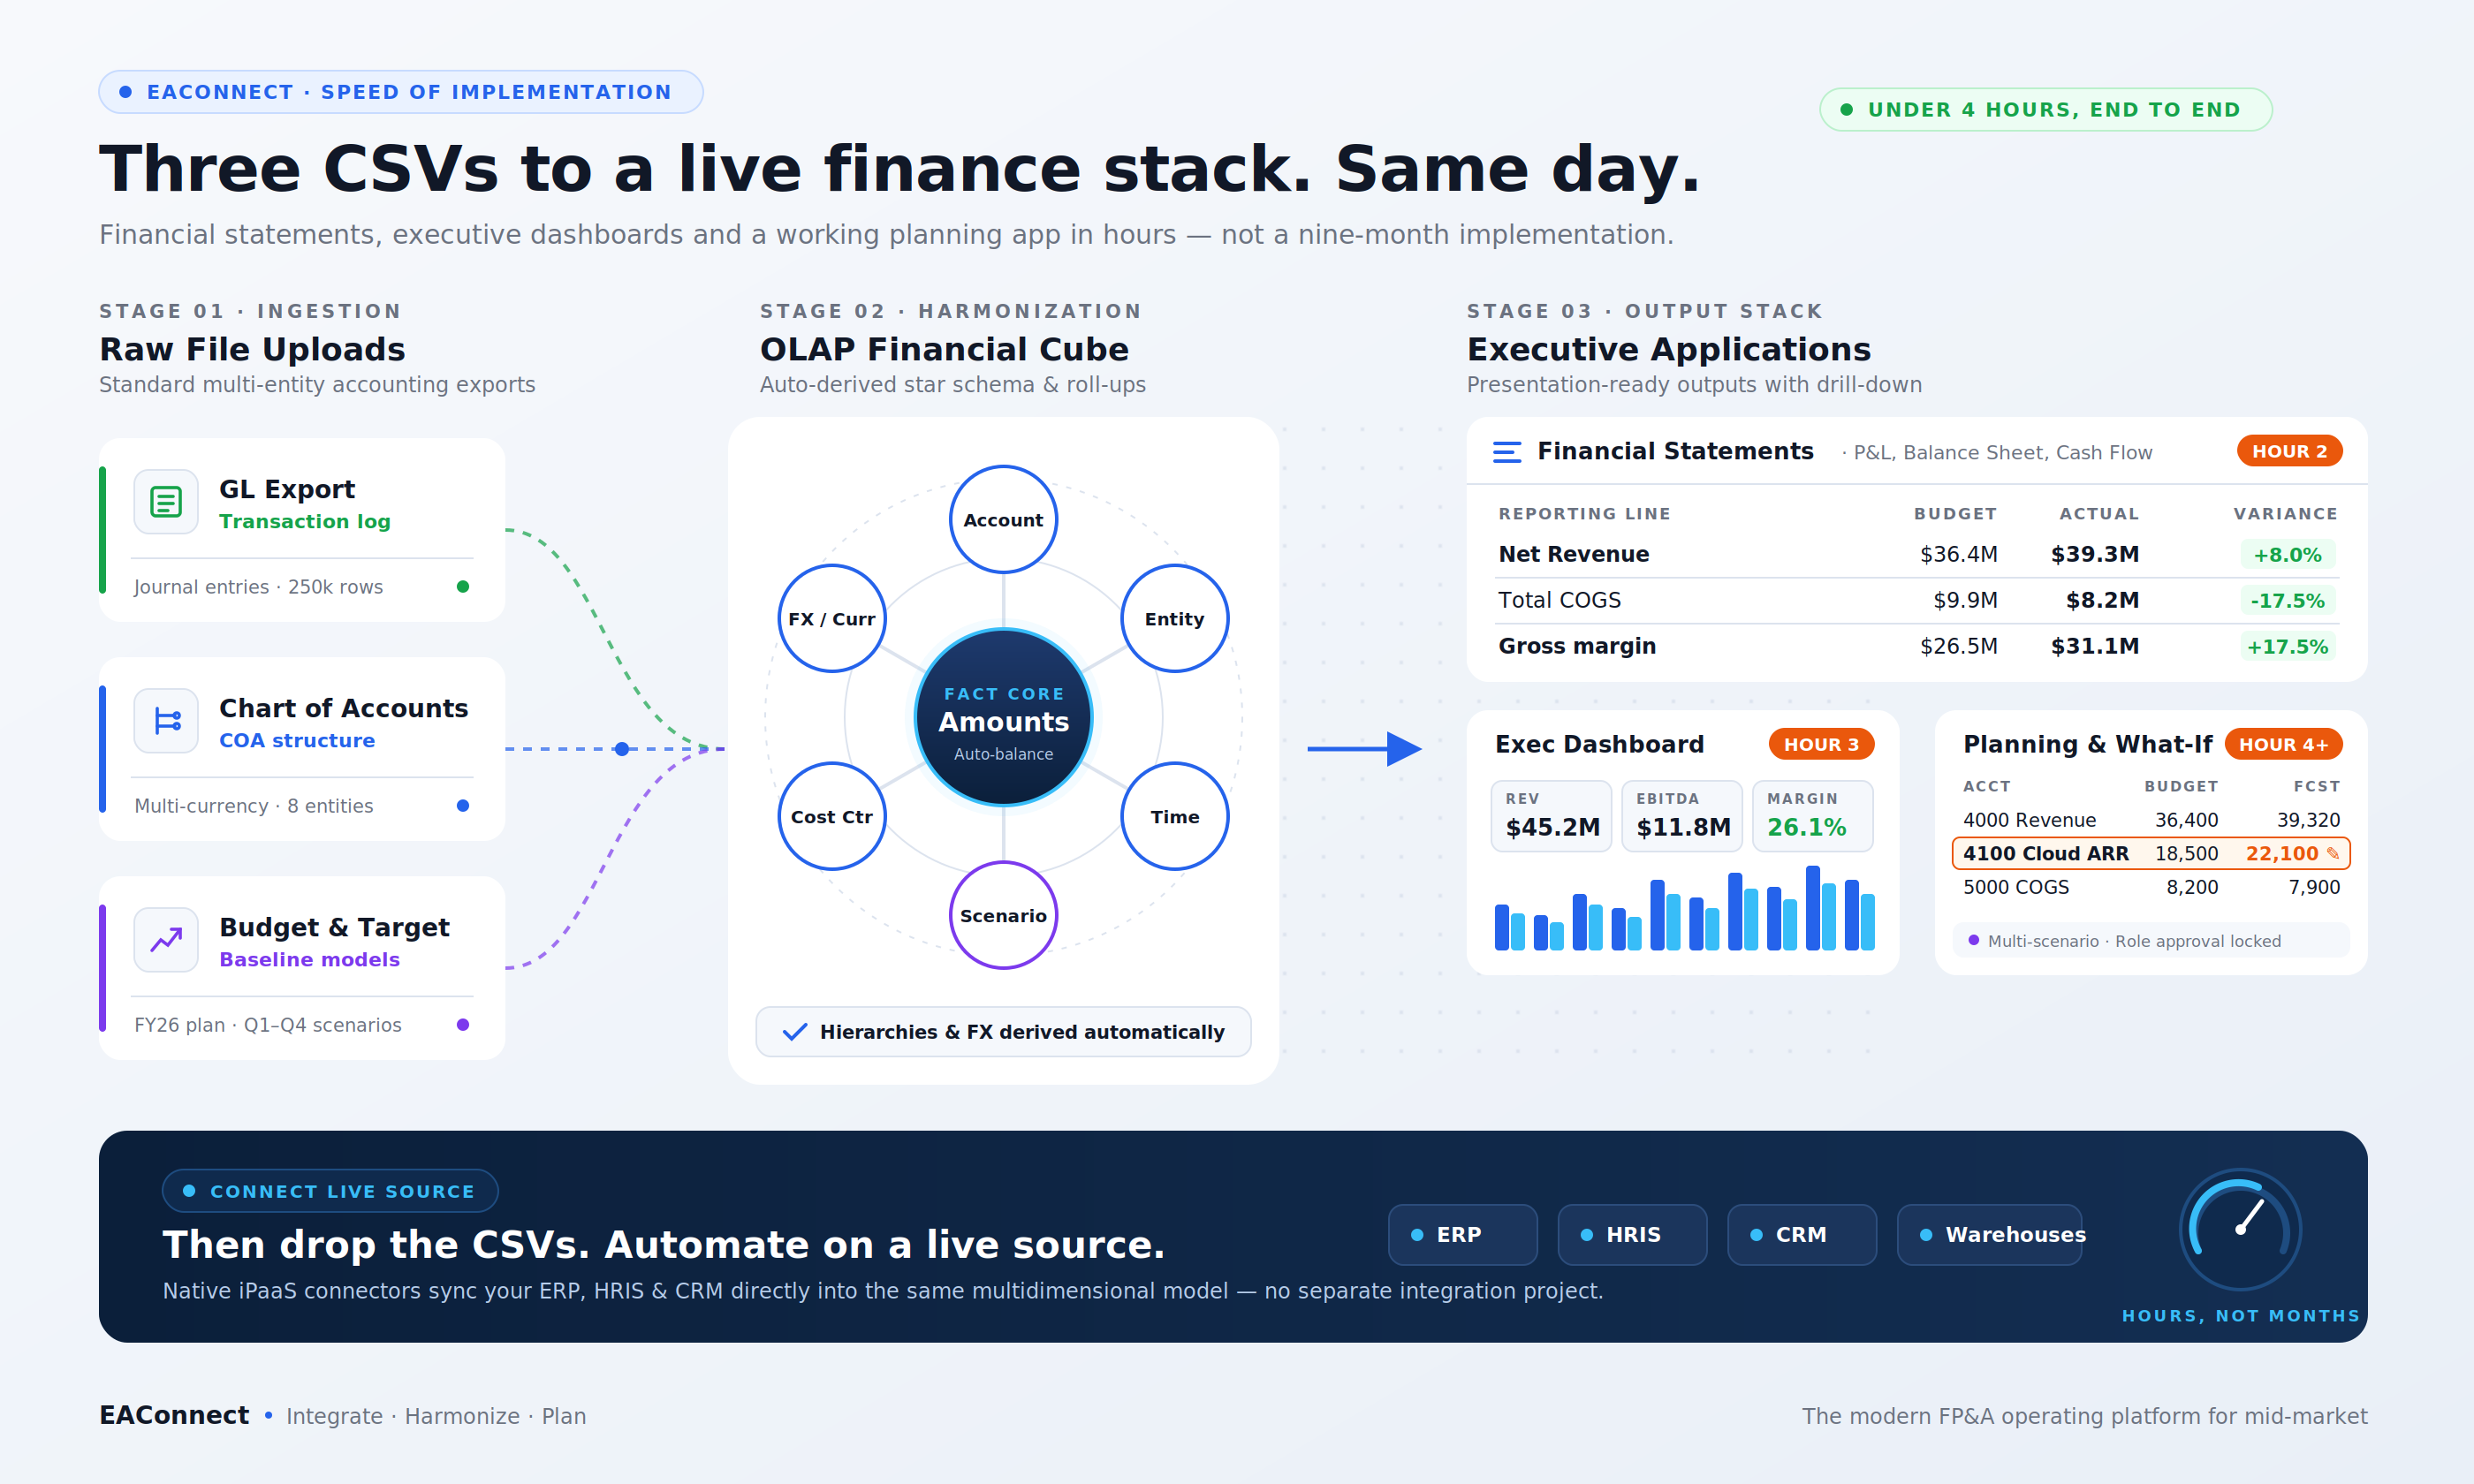
Figure 1. Three CSV files in, a finance stack out
The gap nobody talks about
Every mid-market finance team sits on the same three artefacts:
- A general-ledger export — account, entity, period, amount.
- A chart of accounts with its roll-up structure.
- A budget and a forecast, usually in a spreadsheet somebody guards with their life.
That is genuinely all the raw material a CFO needs for a variance-analysed P&L, a live dashboard and a driver-based budget model. Yet the conventional route from those files to that outcome is a data-warehouse project, a BI tool, a separate planning platform, and an integration layer to keep them all in sync. Twelve to eighteen months, a seven-figure total cost of ownership, and a permanent dependency on whoever built it.
EAConnect exists to collapse that. This post walks through exactly what is feasible when the only source is CSV files — and then what changes when you plug the platform straight into your source systems.
Hour 1 — Load the files, get a model
Drop the three files into EAConnect. The platform profiles them and derives a multidimensional model automatically: one fact table of financial movements, with conformed dimensions for Account, Entity, Time, Scenario/Version, Cost Centre and Currency.
Two things matter here.
The hierarchy comes with the data. A chart of accounts that says 4000 – Total Revenue contains 4100 – Product Revenue, which contains 4110 – Hardware Sales, is read as a hierarchy, not a flat list. Roll-ups, subtotals and drill-downs are inherited, not rebuilt by hand.
Scenarios are first-class. Actual, Budget and Forecast land as members of a Scenario dimension, not as three separate tables. That is what makes "Q1 Budget vs Q1 Actual vs FY Forecast" a column selection instead of a modelling exercise.
If you have worked in SAP BPC, Anaplan or OneStream, this is the model you would have built anyway. The difference is that nobody had to build it.
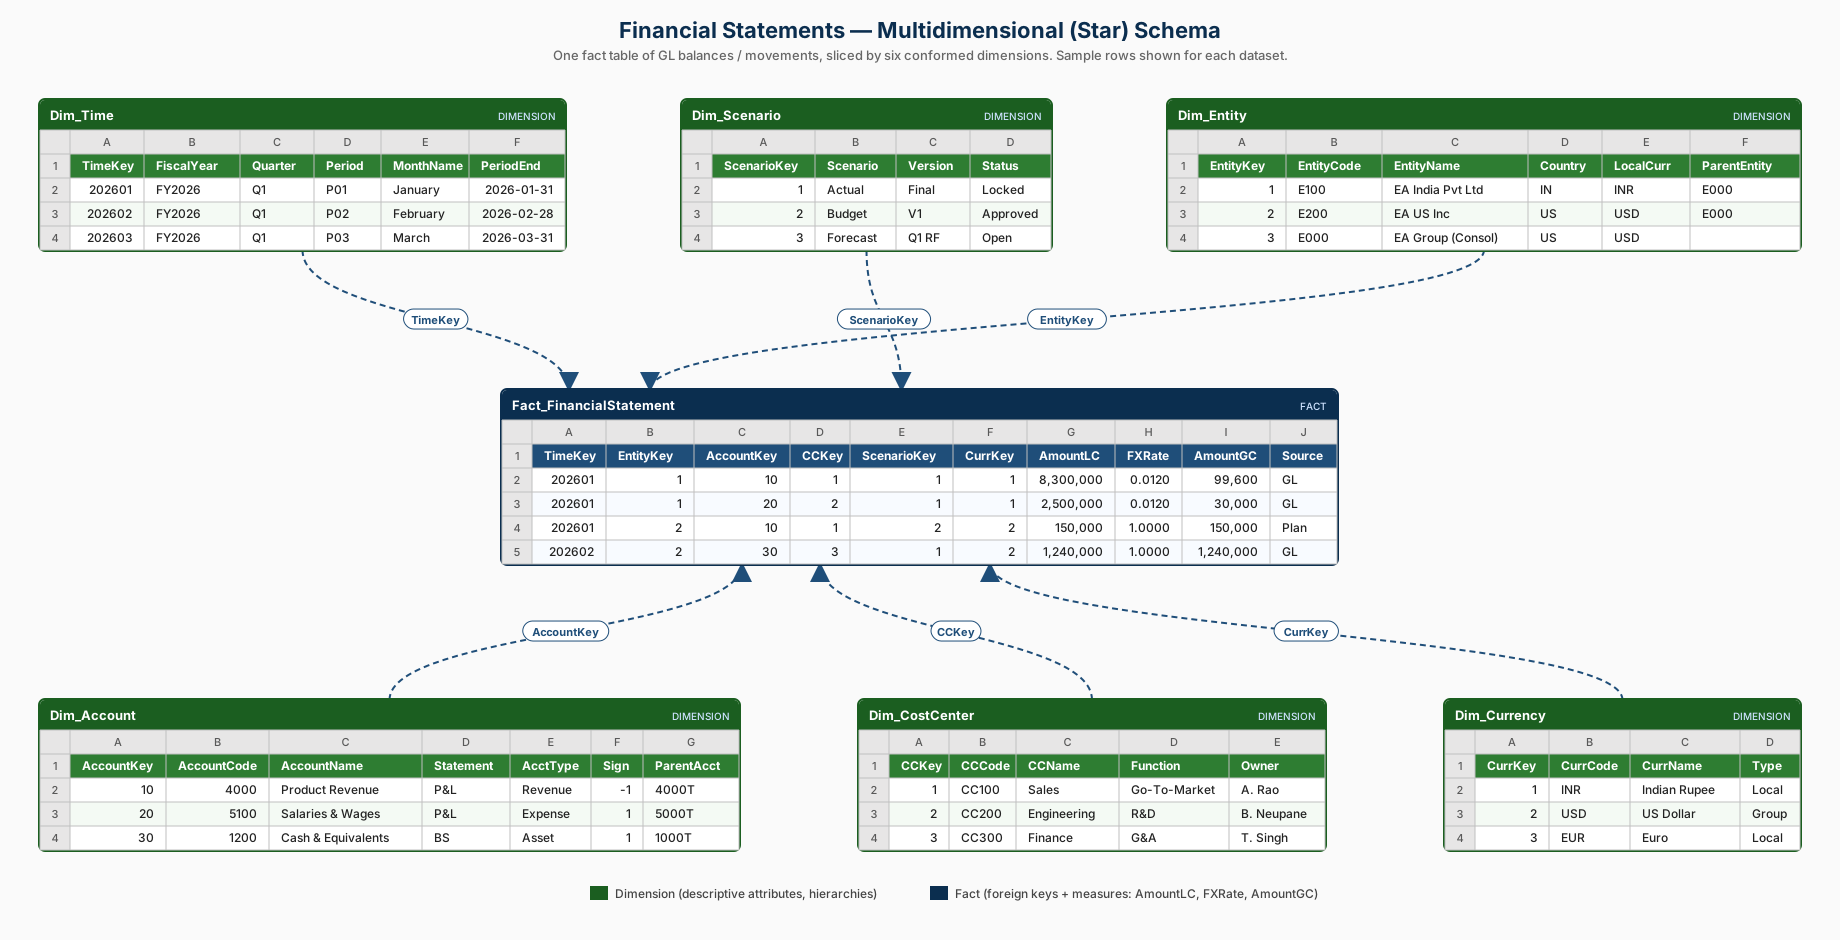
Figure 2. Star schema derived from three CSV files
Hour 2 — Financial statements
With the model in place, the statement layer is configuration, not development.
P&L with variance
The P&L statement view shows Q1 Budget, Q1 Actual, FY Budget, FY Forecast, Variance and Variance % side by side. Sections (Cost of Goods Sold, Operating Expense, Below the Line) are grouped, subtotals (Total COGS, Gross Margin, Operating Income, EBT, Net Income) are computed from the hierarchy, and favourable/unfavourable variances are colour-coded by account type — a revenue shortfall and a cost overrun both show red without anyone maintaining a sign convention.
A memo line such as EBITDA is defined once as a calculated member and appears wherever the P&L is used.
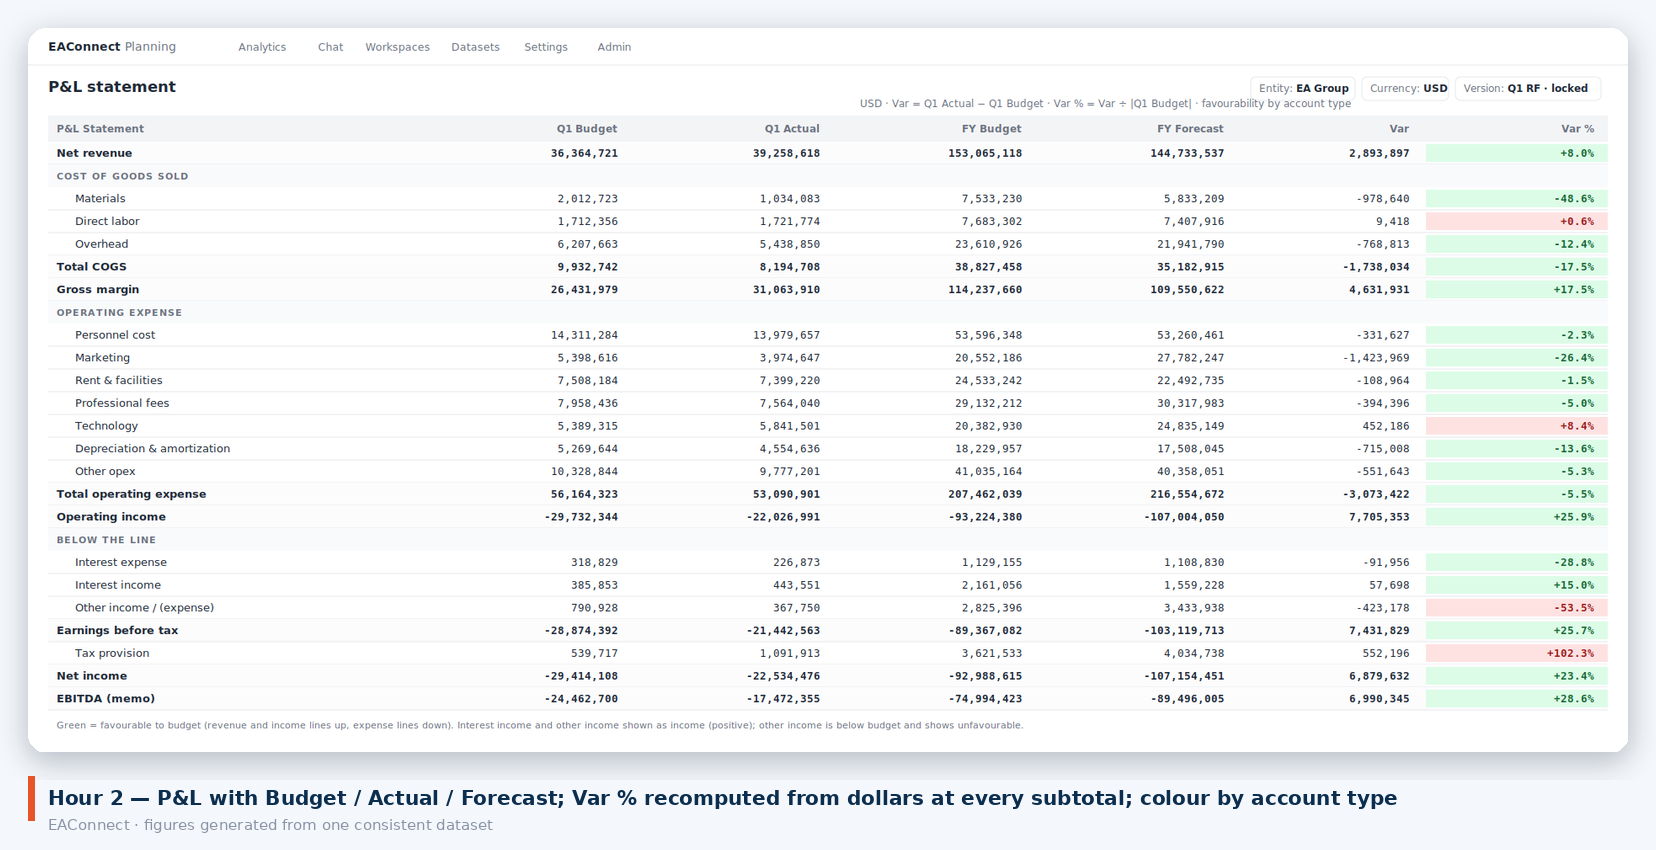
Figure 3. P&L with variance
Income Statement by entity, by month
Switch to the multi-period view and the same model renders a monthly income statement for a chosen division — twelve columns plus a total, expandable from IS – Income Statement down through 4000 – Total Revenue → 4200 – Service Revenue → 4220 – Maintenance & Support. A Balance Sheet tab sits alongside it on the same data.
Filters, search across dimensions, export to Excel and an "immersive" full-screen mode are built into the grid. Change the entity selector and the whole statement re-pivots.
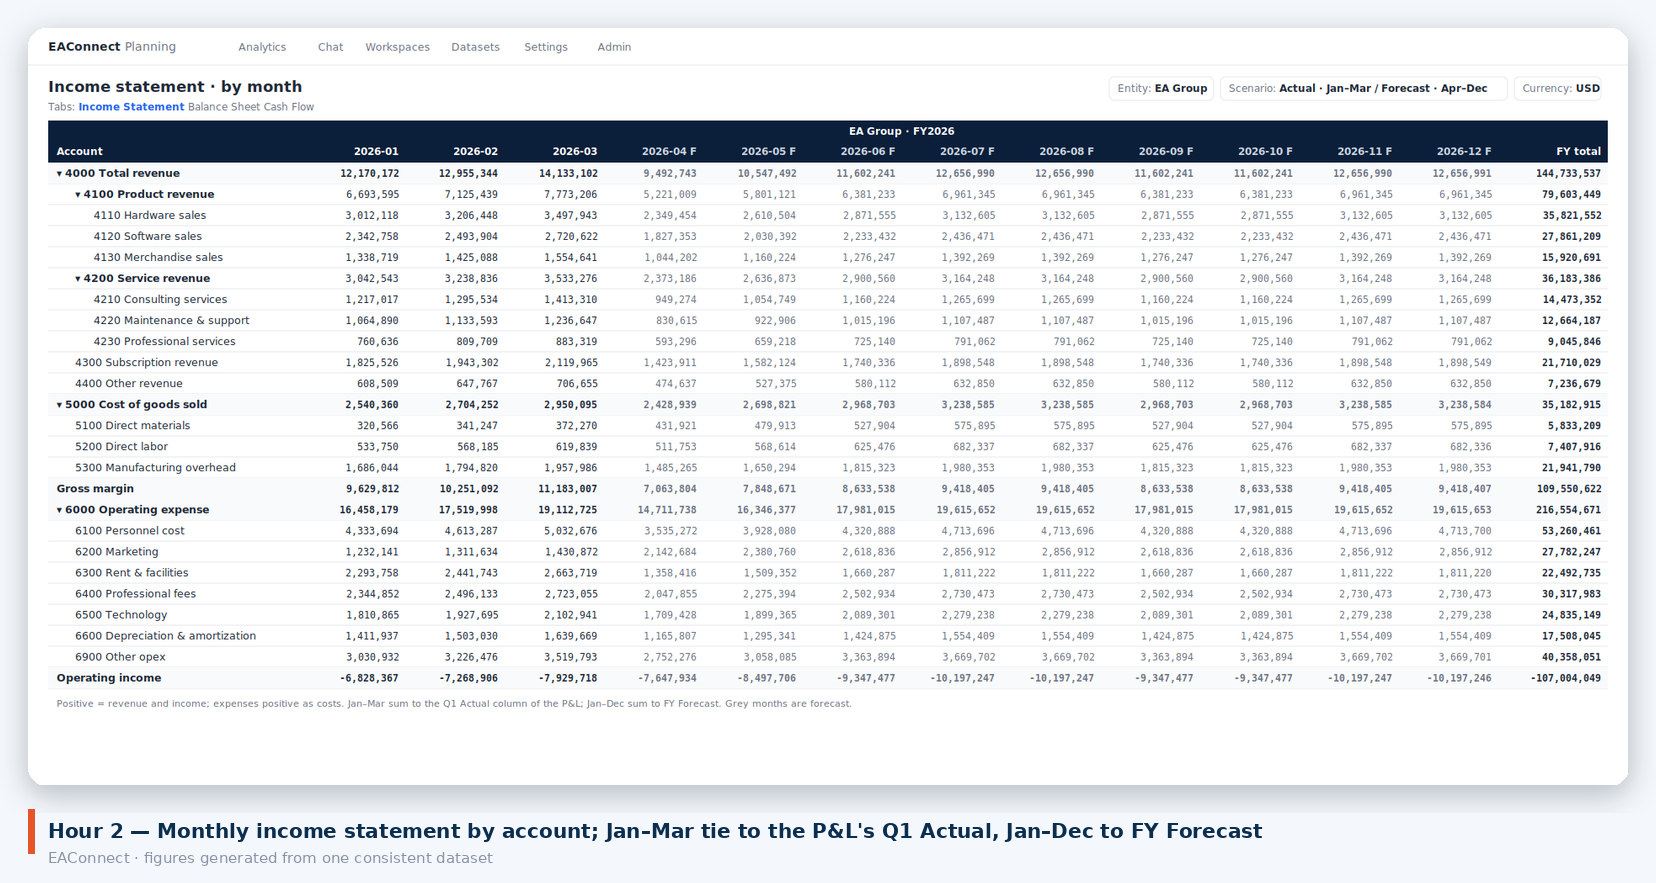
Figure 4. Monthly income statement by entity
What used to be a reporting pack assembled monthly is now a live view that is correct the moment the data lands.
Hour 3 — The executive dashboard
The Financial Overview dashboard is built from the same model, filtered by Period and Entity:
- KPI tiles — Net Revenue, Gross Profit, EBITDA, Net Income, Operating Margin, Cash Balance, each with a prior-year or budget comparison.
- P&L Bridge — a waterfall from Revenue through COGS, OpEx, D&A, Interest and Tax to the bottom line.
- Budget vs Actual by department.
- Monthly Revenue & Expenses with margin % on a secondary axis.
- Expense Breakdown treemap.
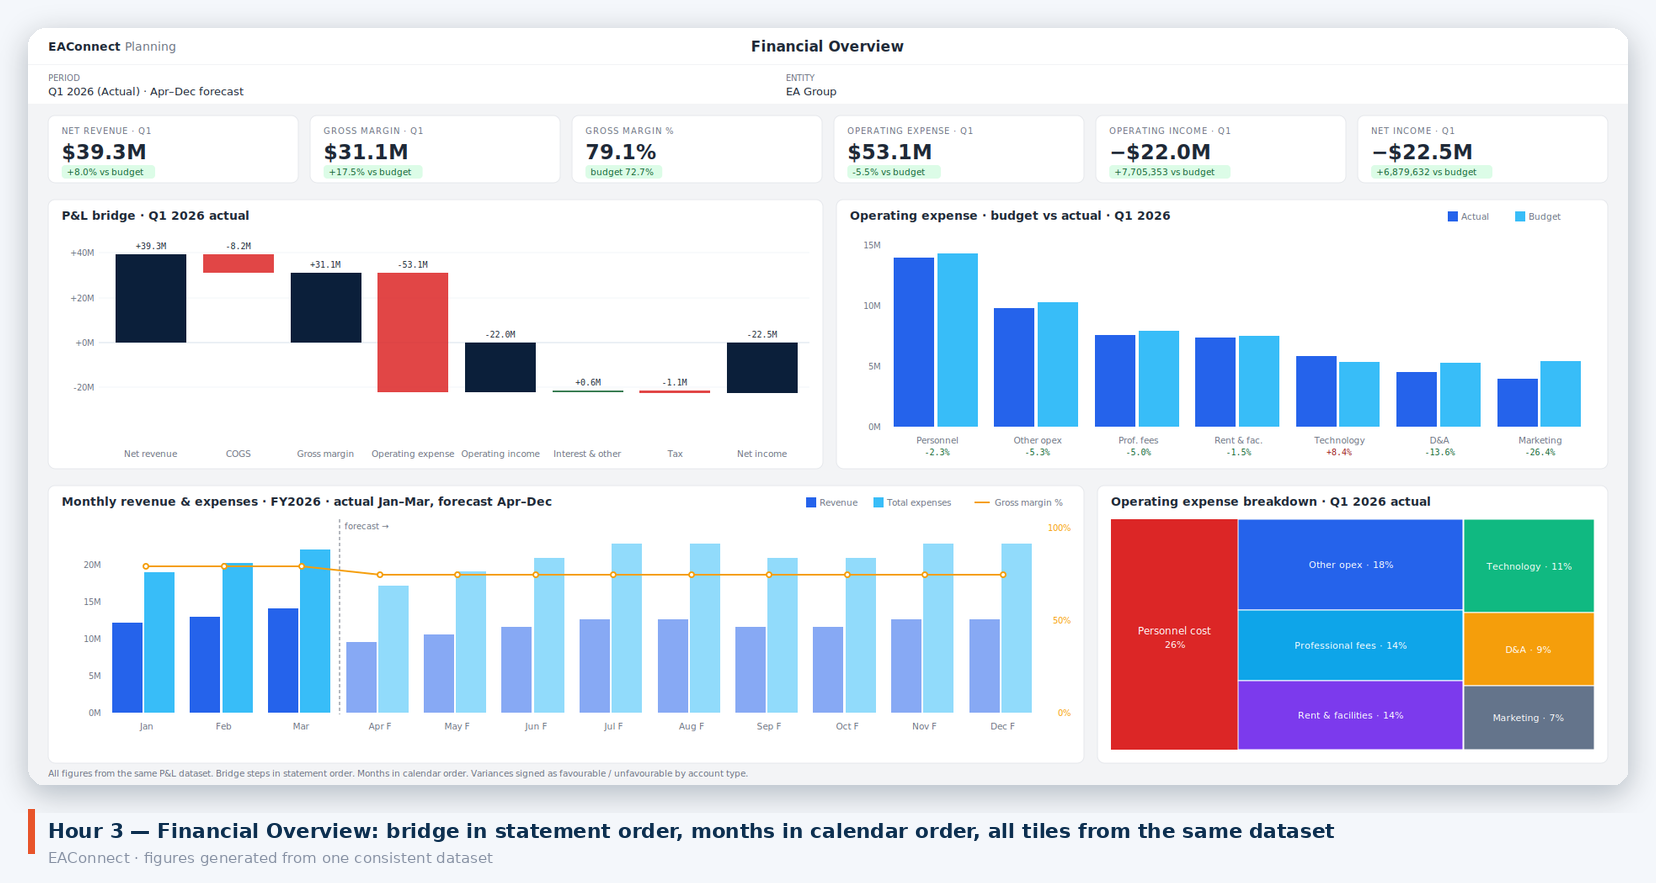
Figure 5. Financial Overview dashboard
Because every chart reads the same dimensions, a filter applied at the top cascades everywhere. And because EAConnect is AI-native, the dashboard carries an Ask Financial Overview assistant: a finance lead can type "why is operating income above budget in Q1?" and get an answer grounded in the actual variance lines, not a generic explanation.
Hour 4 and beyond — A planning application, not just reports
This is where most analytics tools stop and a second product begins. In EAConnect the planning layer is the same platform, the same model, the same dimensions — with write-back.
The ABS Planning Suite example shows what a working planning app looks like:
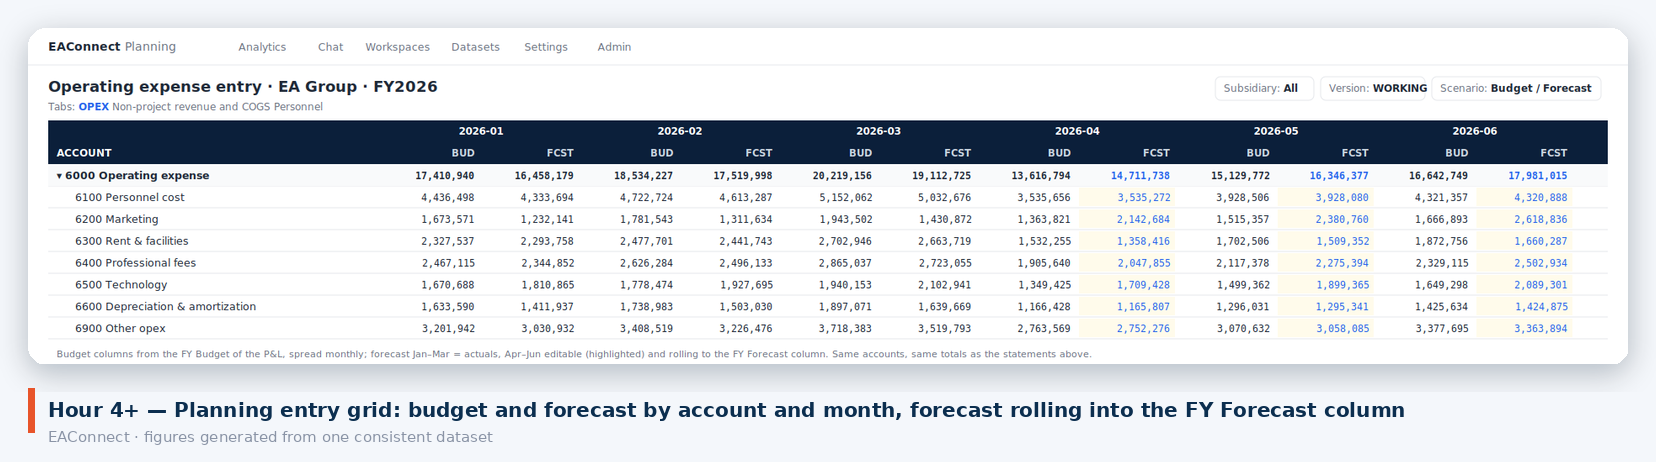
Figure 6. Planning application input grid
- Input grids — Budget and Forecast columns per month, per account, with a Subsidiary selector and a Version selector (e.g. WORKING). Users type directly into the cells; roll-ups (Gross Profit, Operating Profit, Net Income) recompute on entry.
- A structured application, not a loose set of screens: Executive Overview, Planning Cycle Cockpit, Planning Drivers, Cost-Type-to-Account mapping, Project Budget Entry, Project Portfolio, Plan vs Actual, Forecast Adjustment, OPEX and COGS Entry, department views, and a Budget Review & Approval and Budget Submission workflow.
- Versions and scenarios — WORKING, submitted, approved — so the planning cycle has governance rather than a folder of file copies.
For teams that have priced Anaplan or SAP BPC for this, the point is not that EAConnect does something exotic. It is that the model you loaded in Hour 1 is the planning model, so there is no second implementation, no second data load and no reconciliation between "reporting numbers" and "planning numbers".
What "hours" honestly means
To be precise about the claim:
| Step | Effort with CSVs as source |
|---|---|
| Load GL, chart of accounts, budget/forecast files | Minutes |
| Dimensional model derived, hierarchies recognised | Automatic; review takes under an hour |
| P&L / Balance Sheet / Income Statement views | Configuration — an hour or two |
| Executive dashboard | An hour or two |
| Planning input grids, versions, workflow | Half a day to a day depending on cycle complexity |
A working proof-of-concept on real data in a day. A production planning application in a week or two, most of it spent on business decisions (driver logic, approval chain) rather than technology.
Then remove the CSVs entirely
CSV is the simplest source, and a good place to start because it proves the outcome before you touch a single integration. But EAConnect began life as an iPaaS, and the connectors are native to the platform — not a separate middleware purchase.
That means the same pipeline that reads a GL export can read the GL directly from NetSuite, SAP, Acumatica, Xero or another ERP on a schedule; pull headcount from the HRIS for personnel-cost planning; and pull pipeline from the CRM for revenue forecasting. The statements, dashboard and planning app do not change. Only the source does.
The order of operations is deliberate: prove the value on files in hours, then wire in the systems of record when you are ready — rather than starting with a six-month integration project and hoping the value shows up at the end.
Who this is for
Mid-market companies — roughly $50M to $500M in revenue — with a finance team that is too big for spreadsheets and too lean for a two-year transformation programme. If your month-end pack is assembled by hand, your budget lives in a shared workbook, and your last planning-tool quote made the CFO wince, this is the gap EAConnect was built for.
If you would like to see it on your own files, send us three CSVs. We will show you the rest by the end of the day.